plot_miss_var
![]()
概要
R言語の naniar::gg_miss_var() をオマージュした関数で、データフレームの各変数について欠測値の量を横棒グラフとして可視化します。欠損値統計の計算には py4stats.diagnose() を使用しています。
plot_miss_var(
    data: IntoFrameT,
    values: Literal['missing_percent', 'missing_count'] = 'missing_percent',
    sort: bool = True,
    miss_only: bool = False,
    top_n: Optional[int] = None,
    fontsize: int = 12,
    ax: Optional[Axes] = None,
    color: str = '#478FCE',
    **kwargs: Any
)
引数 Argument
data:IntoFrameT(必須)
入力データ。narwhals が受け入れ可能な DataFrame 互換オブジェクト
(例:pandas.DataFrame、polars.DataFrame、pyarrow.Table)を指定できます。normalize:str
グラフに表示する値の種類。missing_percent列毎の欠測率をパーセンテージで表示します。columns列毎の欠測数を表示します。
sort:bool
プロット前に選択した指標で列をソートするかどうか。初期設定は True です。。miss_only:bool
欠測値を含まない列を除外するかどうか。True だと欠測値を含まない列を除外し、False(初期設定)だと省略せずに全ての列を表示します。top_n:int
棒グラフを表示するグラフの個数。top_n = None(初期設定)の場合、すべての棒グラフを表示し、整数値が指定された場合、欠測率(数)の上位top_n件が表示されます。ax
matplotlib の ax オブジェクト。複数のグラフを並べる場合などに使用します。fontsize:int
軸ラベルなどのフォントサイズ。palette:list of str
グラフの描画に使用する色コード。棒グラフの色に対応します。
使用例 Example
import py4stats as py4st
import pandas as pd
from palmerpenguins import load_penguins
penguins = load_penguins() # サンプルデータの読み込
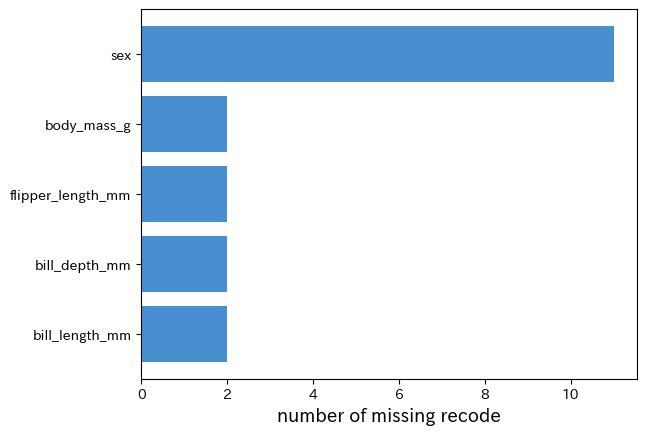
py4st.plot_miss_var(penguins)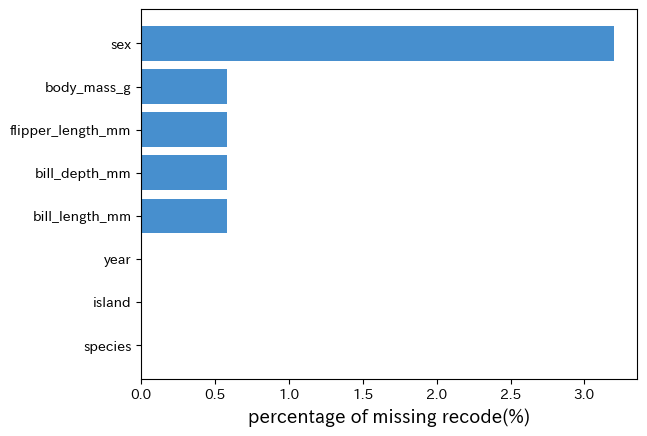
py4st.plot_miss_var(penguins, values = 'missing_count', miss_only = True)